A Vulnerability Scan is NOT a Penetration Test. Unfortunately, when we perform third-party reviews or risk analyses, we often see that organizations get these two terms mixed. In this article, we are providing information about the differences so companies get the accurate services they need (and paid for) and they can achieve their compliance goals.
Here is a quick high-level guide to help clarify the differences.
Exploitation – penetration tests (pen tests) exploit vulnerabilities to gain additional access. Vulnerability scans search for vulnerabilities, but don’t exploit them.
Automation – vulnerability scans are automated processes. An individual configures the scan and then the program does all of the scanning for vulnerabilities. Penetration Testing is largely a manual process although the security professional often uses an array of tools to assist including vulnerability scanners. Penetration Testing requires a more advanced skill set as the security professional needs to find new ways of compromising systems.
Attack Simulation – a penetration test simulates a full cyber attack from initial reconnaissance to active testing to obtaining credentials to elevating privileges to accessing data to exfiltration of the data. A vulnerability scan typically consists of a single attack phase.
Cost – since penetration testing requires a more advanced skill set, performs a more comprehensive analysis, and takes more time, the cost is much higher.
Frequency – since vulnerability scans are less expensive and are quicker to perform, they are performed more frequently than penetration testing. While there is much flexibility on the frequency, vulnerability scans are usually performed daily, weekly, or monthly. Penetration Testing is usually performed annually or after major changes in an environment.
While there are a number of differences, both penetration testing and vulnerability scanning are best practices in a security program.
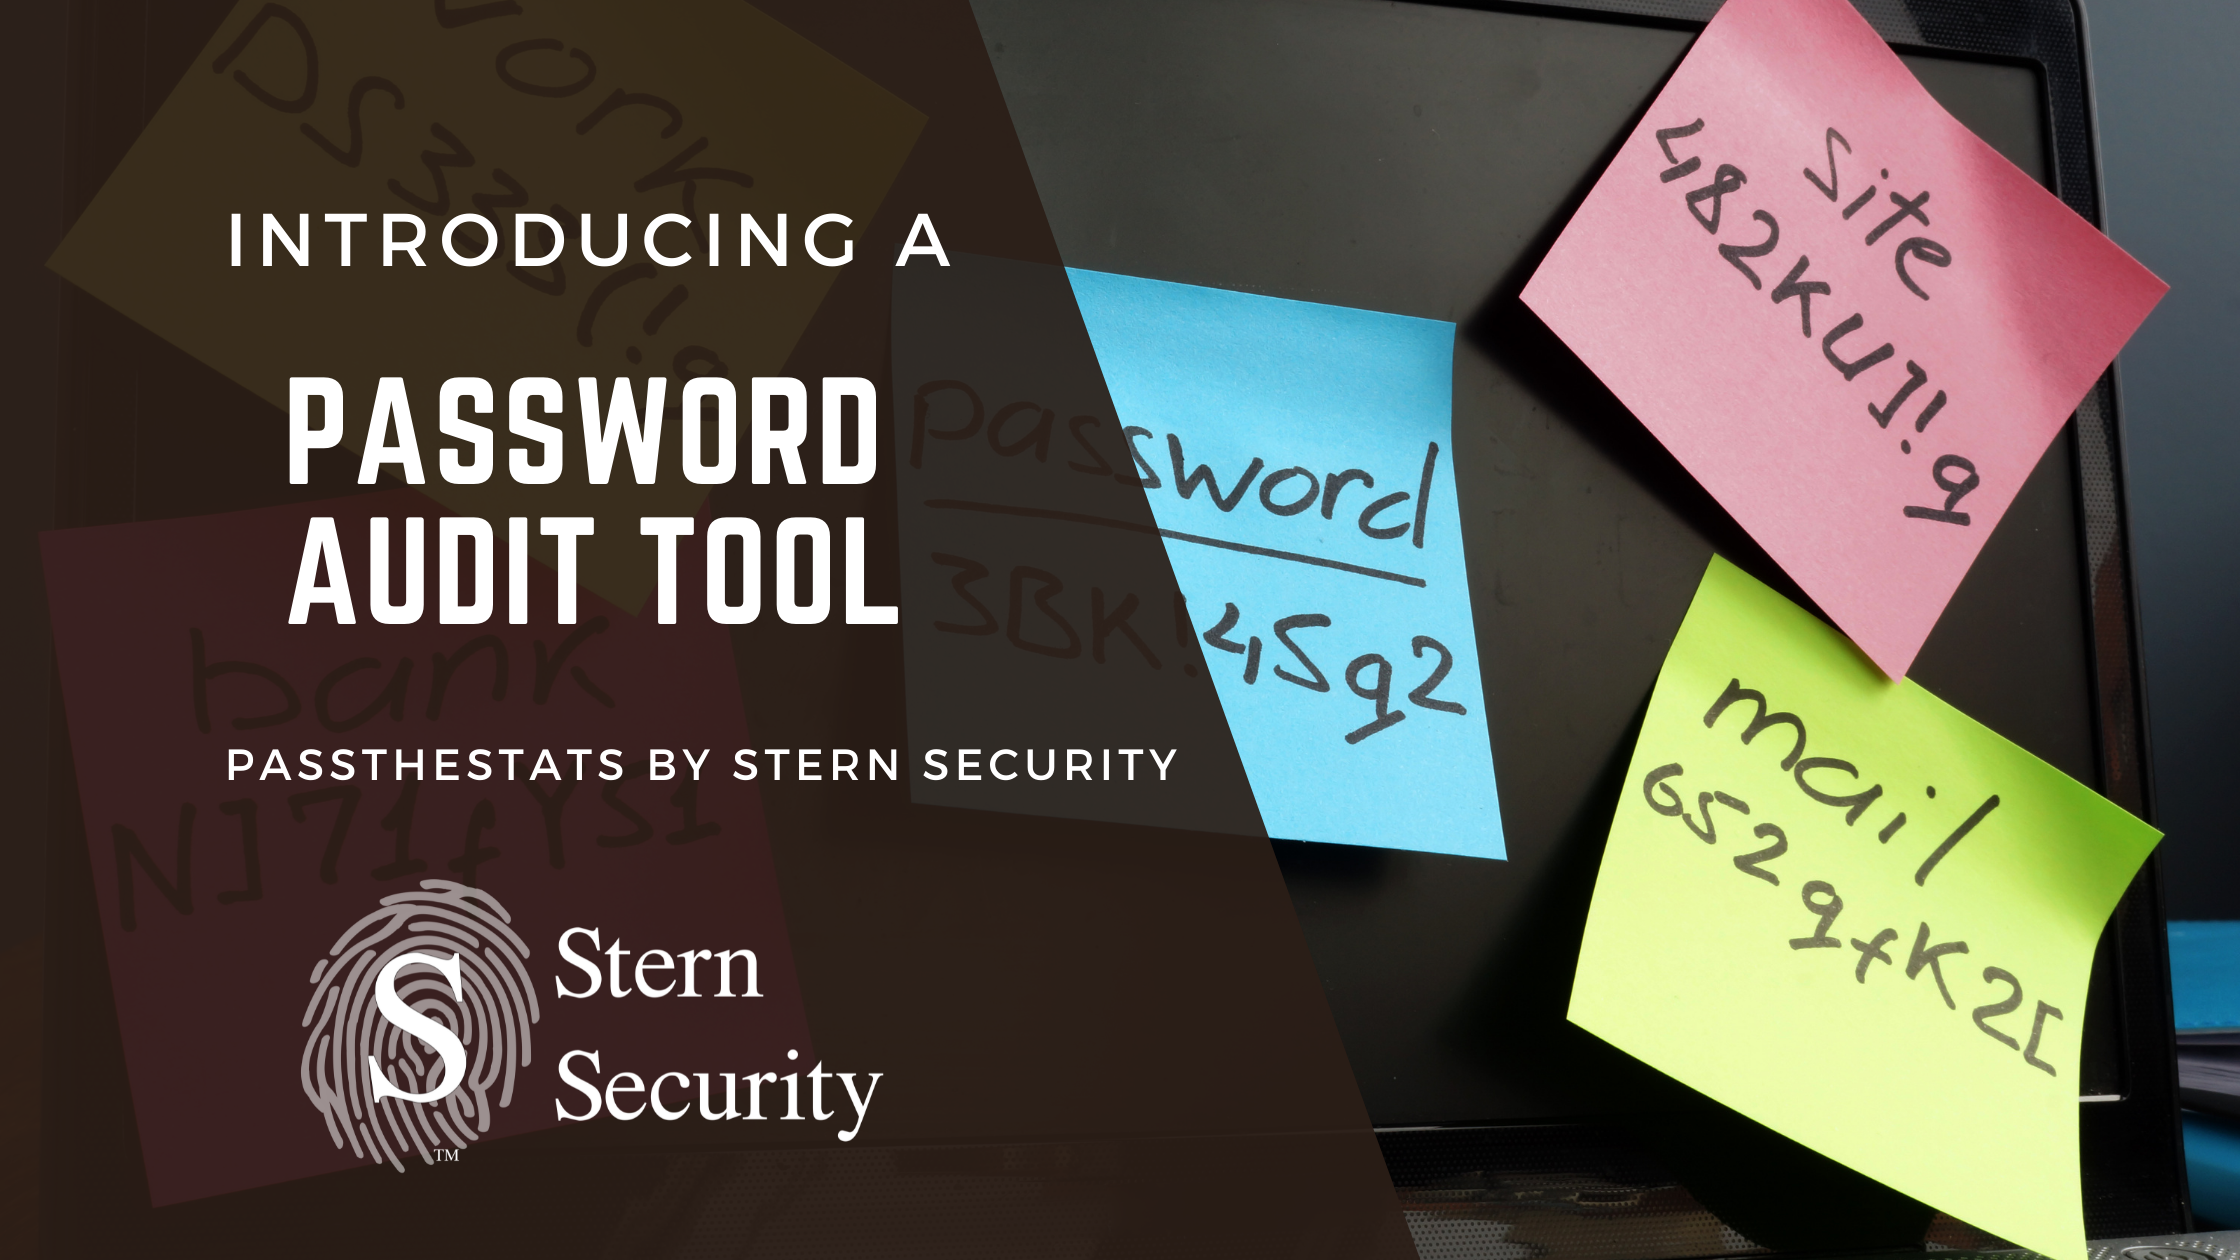
Weak passwords are often the cause of data breaches. Love or hate them, everyone is using passwords today. Ensuring individuals are using strong passwords in important to securing an organization. Whether you’re performing a penetration test or a password audit, tools can help you add value and efficiency for your report.
At Stern Security, we created a tool called PassTheStats (https://github.com/sternsecurity/PassTheStats) to provide insight into the password strength. This has been incredibly helpful on penetration tests as we use the tool to perform password audits when we gain access to password databases. Simply feed the tool a text file of usernames and passwords in the format “username:password”, and the tool will give you the following:
Number of passwords less than 8 characters
Number of passwords equal to their username
Number of accounts with blank passwords
Number of accounts that may be administrators
Number of non-complex passwords
Top 10 most popular passwords
A full list of accounts with weak passwords and the reason each is weak
This tool has added great value to our penetration test reports, increased efficiency, and helped increase security. We hope you find it valuable as well 🙂
Technical Info Here are some quick technical points to help you use the tool.
Download a. Download the tool with the following command: git clone https://github.com/sternsecurity/PassTheStats.git
Password List a. There is a sample password list in the folder that is downloaded. You’ll need to use the same format for your file. The format is the following Username1:password1 Username2:password2 Username3:password3
Run the program a. Go to the PassTheStats folder and launch the tool with the following command: python3 PassTheStats.py [PASSWORD_FILE.txt] b. If you are running the command on the provided sample_cracked_password_file.txt, you would type the following: python3 PassTheStats.py sample_cracked_password_file.txt
Results a. The executive overview will be posted to the screen. The details of all of the password issues will be listed in a file that gets generated.
Vendor Risk Management Accuracy is all that Matters!
Many organizations utilize spreadsheets to measure their internal security posture and vendor risk. We get it – spreadsheets are simple, convenient, and it comes with the office suite that you have on your computer. Unfortunately, it does not scale and gets out of hand quickly.
Let’s look at the internal side first. Many people have exported security frameworks and regulations to Excel and other spreadsheet applications. You can easily add a column to state whether or not your organization has a control in place. Once your organization starts using the document more, things start falling apart.
Measuring vendor risk with spreadsheet questionnaires is not any better.
Here are the top five issues:
Point in Time Review – It’s tough to show improvements over time with the spreadsheet unless you get very creative. Generally, the spreadsheet shows the security posture at only a single point in time.
Updates – When the frameworks, regulations, or vendor questionnaires change, a new spreadsheet must be developed and the work redone.
Multiple Users – Sharing the file amongst multiple people may be difficult with concerns over individuals making changes at the same time, version control, and storage of the file.
Macros – Many of the complex spreadsheets use macros which can lead to security issues as malware often utilize macros to execute.
Scale – The spreadsheets may work well for keeping track of a few risk items, but not your entire security posture or all of your vendors. It quickly becomes difficult to manage, annoying to share, upkeep is tedious, and it cannot show trends and improvements.
We’ve all been through the pains of using spreadsheets to measure vendor risk and that is one of the reasons why we built Velocity (https://www.velocitysec.com). To highlight these spreadsheet inefficiencies, we also created a “Spreadsheet Anonymous” support group video. Everyone that has been in this spreadsheet nightmare will enjoy this humorous video :-).
For a look at how Velocity helps companies manage their security posture and vendor risk:
Book a Demo of Velocity to Learn about Vendor Risk Management Accuracy
Sending Duo Logs to a Syslog Device: Duo + Fluentd
Duo Security is one of the most popular 2-factor authentication applications on the market today. All of the authentication and administrative logs are stored in the admin portal located at https://admin.duosecurity.com. Up until recently, if you wanted to view the logs, you either had to log into the admin portal or use the Duo API to query your Duo instance and manually pull the logs. There have been some scripts that individuals have released to perform this API query, but recently, Duo released their own official version: https://github.com/duosecurity/duo_log_sync/.
If you want to use the Duo Log Sync to stream the logs to a SIEM, it works well if your SIEM supports the json TCP stream. However, if your SIEM only supports log file reads or syslog, you need to do some extra work. In this article, we’ll discuss how to use another component, fluentd, to get syslog running with the Duo Log Sync and we’ll also give you regex rules to parse the Duo data. We’ll use a Windows server in our example, but the similar rules apply for Linux.
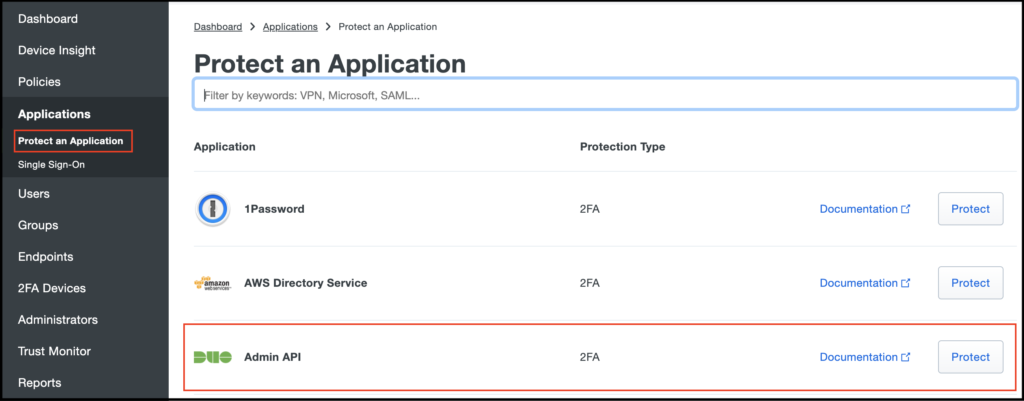
Set up Duo Admin API
First, you’ll need to add the Duo Admin API to your Duo instance.
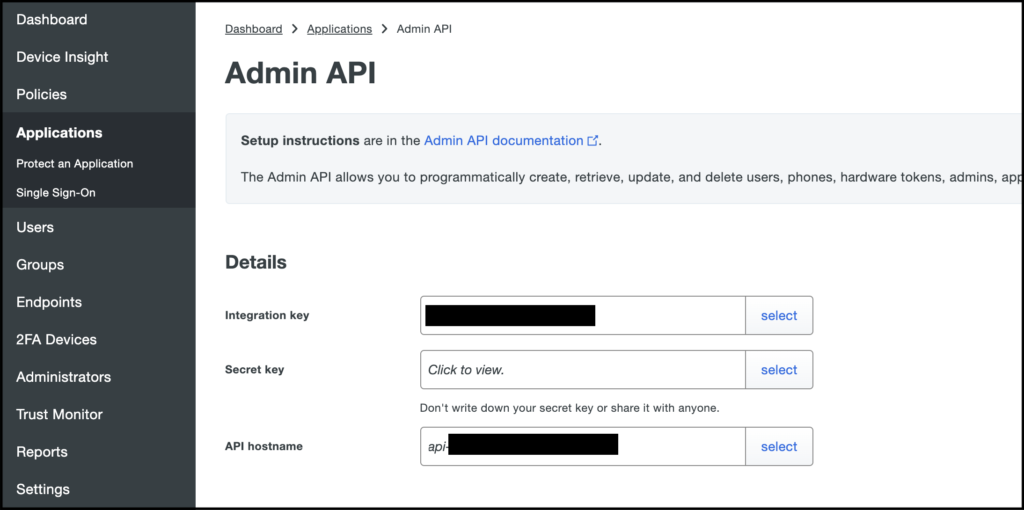
Copy the keys – Once the “Duo Admin API” application is created, you’ll need to copy the hostname and key values to use in the Duo Log Sync configuration.
Use the Integration Key (ikey), Secret key (skey) and API hostname (hostname) values here to populate the configuration script
Set up the Duo Log Sync
Follow the instructions from the README on https://github.com/duosecurity/duo_log_sync/
Install Python3 on the server if it’s not already installed
Download the duo_log_sync program from https://github.com/duosecurity/duo_log_sync/. If you’re on linux, you can just clone the repository. On Windows, if you don’t have GIT installed, just download the zip and extract to the root directory.
Go to the duo_log_sync folder and from the command-line type:
python3 setup.py install
Create a temp folder at c:\temp to store the log files. On Linux, you’ll already have a /tmp folder that can be used.
Create/Edit the config.yml file located here c:\duo_log_sync\duologsync\config.yml Use the Example configuration from the README file as a guide. On Windows, you’ll need to escape the directory references and put the full path (see example config.yml below). Ensure you enter the skey, ikey, and host values from your Admin API application in the Duo Admin Management panel (see screenshot above).
Send data to SIEM or log device If your SIEM supports receiving data via TCP Streams, then all you need to do is put the IP information for the SIEM in the “transport” section of the config.yml file. Unfortunately, some SIEMs do not support this and require either a file dump or syslog. So if you can do the TCP streams, you can skip to the scheduled task section and ignore all of the fluentd steps. Otherwise, proceed to the next section.
Fluentd (https://www.fluentd.org/) can be used to accept the TCP stream data from the Duo_log_sync script and send it to your SIEM via syslog. We need to install and configure this to act as the “proxy” between the duo_log_sync script and your SIEM. This can be installed and configured on the same system that you configured the duo_log_sync, but it can also be installed on a different system. If you’re installing on the same system, then the duo_log_sync config.yml file should contain “localhost” for the “host” field in the “transport” section. If you set up fluentd on a separate system, then add the necessary host information in the config.yml file.
Download fluentd from https://www.fluentd.org/download. We’re using the Windows version here, but you can use any version. Use the respective installation guide per your OS version.
To install, from the td-agent prompt, type the following:
fluent-gem install fluent-plugin-remote_syslog
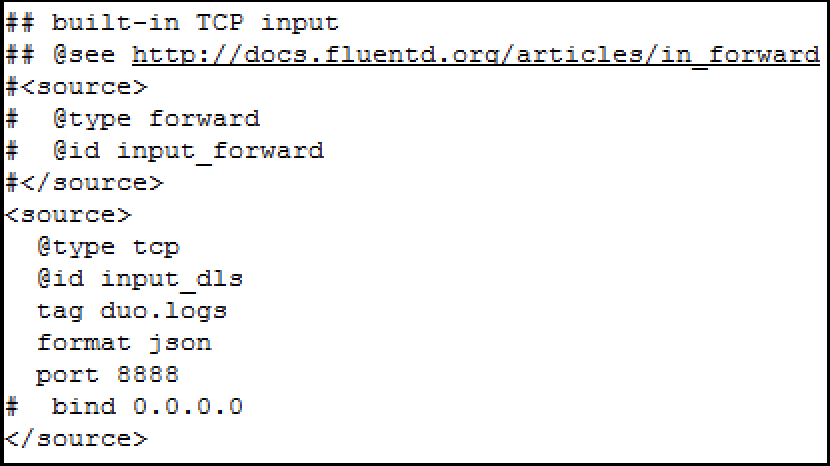
Edit the td-agent.conf file located here on Windows: C:/opt/td-agent/etc/td-agent/td-agent.conf
a. Go to the “built-in TCP input” section and put the following while commenting out the other lines if necessary with “#” characters. It should look like this:
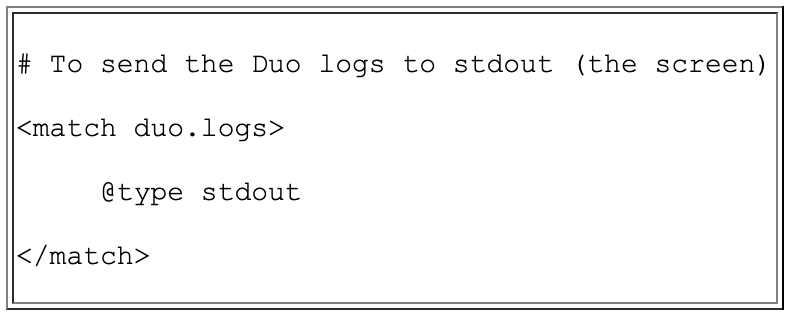
b. (optional) Test the log delivery by sending the Duo logs to the screen. Add the lines below in the script. Otherwise, just skip to the next step to send files to your SIEM.
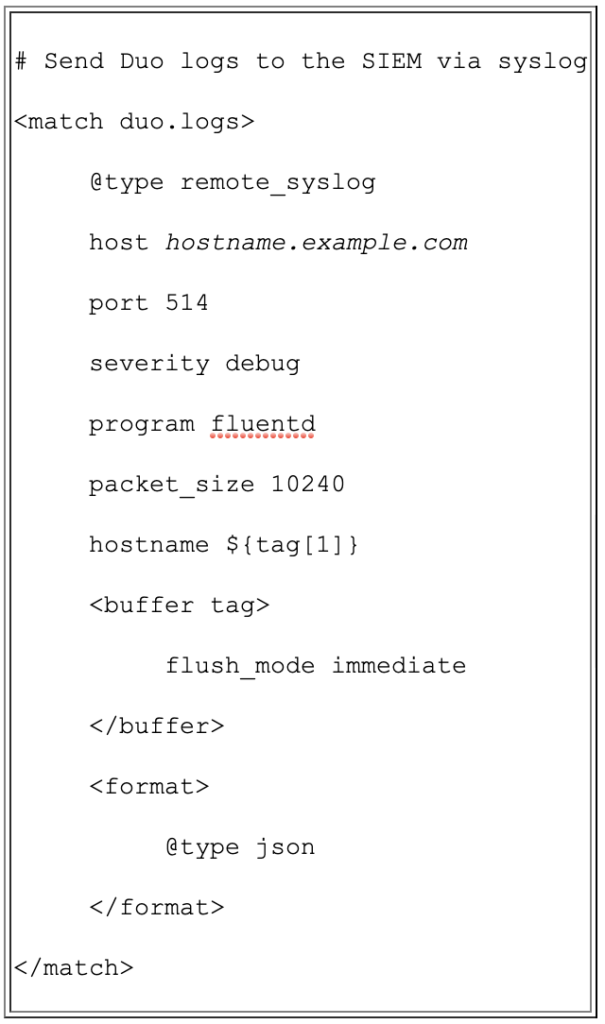
c. To send the logs to the SIEM, use the configuration below. Replace the host information with the hostname of your SIEM.
Test sending logs
Start the td-agent process
a. At the td-agent command prompt, type:
fluentd -c etc\td-agent\td-agent.conf
Run the duo_log_sync script
a. Open an admin command prompt. The duo script will NOT work from a non-admin prompt so you need to right-click on the CMD icon and click “run as administrator”
b. Enter the command to run:
duologsync c:\duo_log_sync\duologsync\config.yml
The command batches 1000 lines at a time and will continuously run. Note, there is a 5 minute delay from when it actually starts collecting logs.
Check progress at c:\temp\duologsync.log
Everything should now work and your logs should be going to the SIEM!
Schedule Task
Once everything works, we’ll want to schedule tasks for this to run automatically. First cancel the current running duo_log_sync and td-agent processes if they are running.
Type the commands below to register tg-agent as a service
fluentd --reg-winsvc i
fluentd --reg-winsvc-fluentdopt '-c C:/opt/td-agent/etc/td-agent/td-agent.conf -o C:/opt/td-agent/td-agent.log'
Using the Windows GUI, go to Control Panel -> System and Security -> Administrative Tools -> Services, and you’ll see Fluentd Windows Service
Start the Fluentd Windows Service and set it to run Automatically
Duo Log Sync as a service
Open the Task Scheduler
Click on “Create Task”
Name: Duo Log Sync
General -> Security Options. Run the task as your designated service account. Ensure the user does not need to be logged in.
Triggers Tab
a. New
b. Set to run at startup
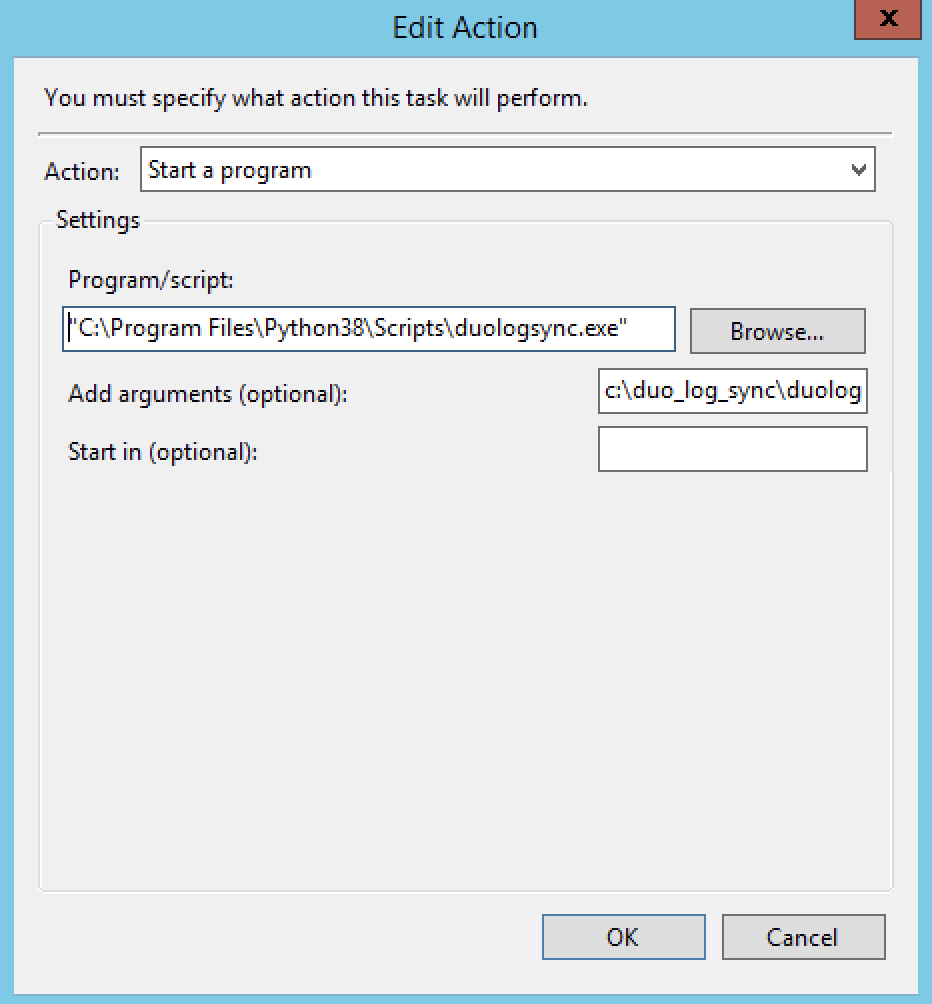
Action Tab
a. Set this to start the Duo program
b. Use the full path to the duologsync.exe file
c. Arguments should be the location of the config.yml file.
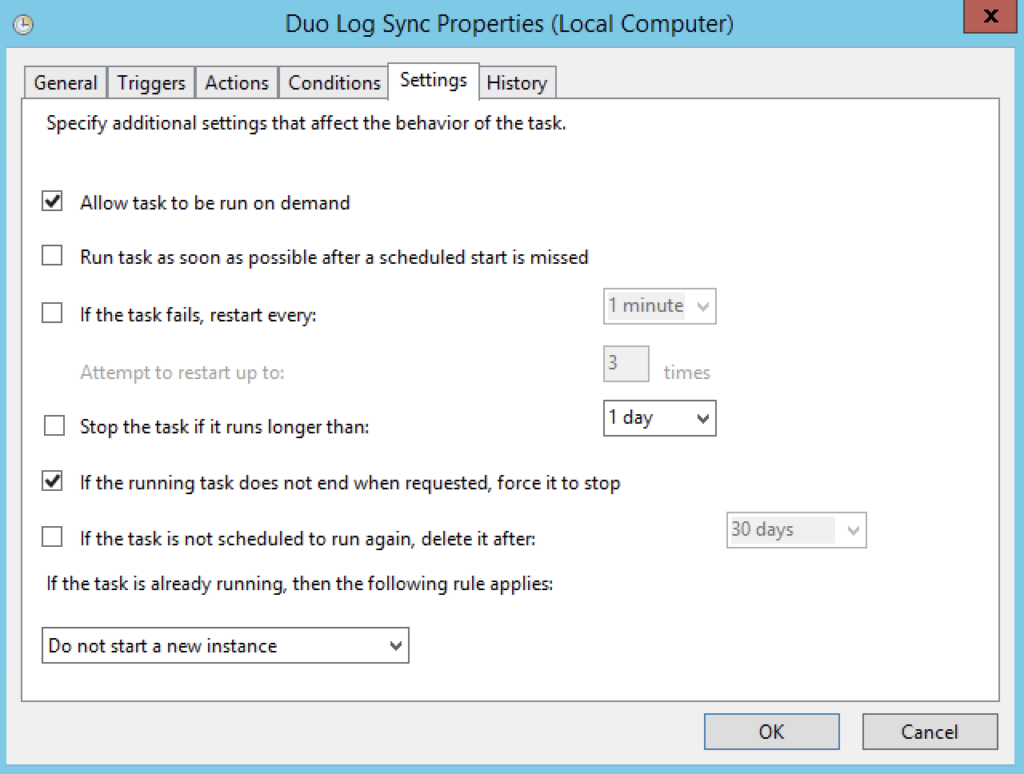
Settings
a. Allow task to be run on demand
Manually kick off the task to start it. It’ll run continuously.
You’re done! You can manually kick off the task to ensure it runs properly.
Duo Log Regex
There are three basic logs in Duo, the Admin logs, auth logs, and telephony logs. To save you some time on parsing these events, here are the event types and associated regex commands.
Without using any 3rd party tools, you can use simple Window commands to display the saved passwords for remembered wireless networks. This is helpful if you forget or during security engagements.
Stern Security gained access to a laptop on a recent penetration test. We needed to gain access to a particular wireless network didn’t want to risk tripping any alerts so we just used Windows commands to get the passwords to saved wireless networks.
Here’s how:
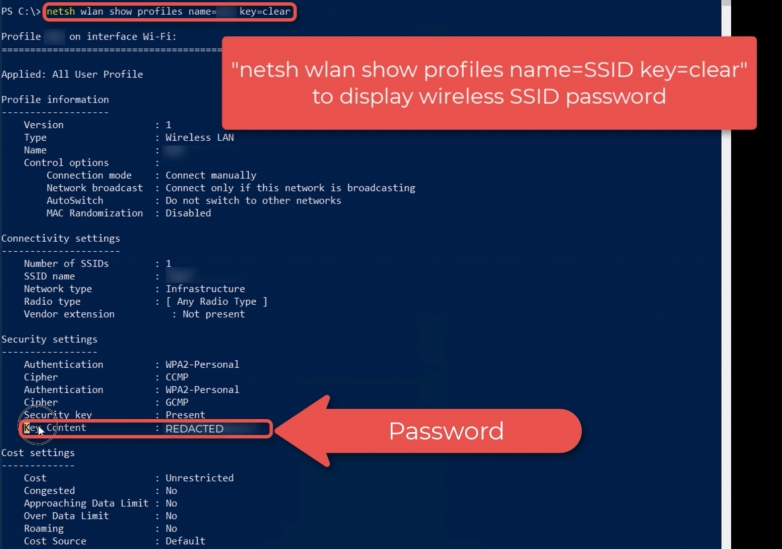
List all saved wireless networks In order to list all saved wireless networks on a Windows device, use the following command:
netsh wlan show profiles
Display password Next, to display the password for a particular Wireless SSID profile, use the following command. Insert the SSID/Profile Name for “PROFILENAME” below:
netsh wlan show profiles name=PROFILENAME key=clear